Excel Dashboards 101

Microsoft® Excel® dashboards are a powerful way to pull together different information in a single place to give a high-level overview of a business. A meaningful "big picture" view of business activities can drive the allocation of scarce resources.
Decisions are easier.
And, the end-user doesn't have to spend valuable time swimming through seas of unimportant information to get to key information.
You could buy expensive software to create dashboards. But, before you do, see what you can do with tools you already possess in Excel.
Join Microsoft Certified Trainer Melissa Esquibel on Thursday, August 8, for Excel Dashboards 101 to discover how to create useful dashboards with financial, production and customer data. Get tips on converting raw data into readable charts, diagrams and tables that are easy to consume.
We'll cover:
- What should be included in your dashboard
- Set-up tips to allow data to easily flow from source to dashboard
- How to make your dashboards resilient to changing data
- Using charts and pivot tables to get just the detail you need
The session will be presented from the newest version of Excel, but the techniques you'll learn will be applicable to Excel 2013 and newer. Some material will also be usable in older versions. To get the most out of this program, attendees should have some experience with Excel charts, pivot tables and formulas.
Among the techniques you'll learn are:
- Importing data from external sources
- Transforming cell data into dynamic graphics
- Creating interactive user interfaces
- Connecting your dashboard to automatically refreshing data
With Excel dashboards, you can step back from the details and see the key trends and relationships that drive business. Join us August 8 for Excel Dashboards 101 and learn how to create effective dashboards easily.
Sincerely,

Pat DiDomenico, Editorial Director
Office Technology Today Answer Center
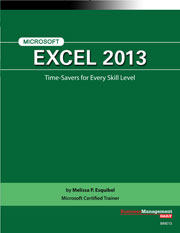
 P.S. Registration Bonus. Sign up for Excel Dashboards 101 and we'll send you Microsoft Excel 2013: Time-Savers for Every Skill Level Executive Summary. Avoid the pitfalls of Excel and get the most out of this program. No matter what your skill level is, Excel can save you time and increase your productivity. This Executive Summary is a combination of not one, but TWO training events led by Microsoft Certified Trainer Melissa Esquibel.
 P.P.S. Extra Added Bonus. You'll also receive a month of access to the Office Technology Today Answer Center. This business software training website provides helpful solutions to your Microsoft Office challenges with training videos… informative Executive Summaries on specific Office programs… a "Help Desk" for your office tech questions… and much more. So that you continue to benefit from the Answer Center, we'll continue your members-only access for just $89 per quarter, unless you tell us "no, thanks" – your choice.
 P.P.P.S. We promise you'll be satisfied. If you decide that Excel Dashboards 101 isn't all we've promised and more, we will refund 100% of your tuition. No questions asked – and your course materials, website access and registration bonus are yours to keep.
August
8
- Thursday, August 8th
- 1 - 2:15 p.m. ET
- 10 - 11:15 a.m. PT
Since this is a webinar, you and your entire staff can attend in the comfort of your office or conference room for one low price! You may include as many people as you wish while listening on a single phone line or computer. Contact us for multi-site discounts.